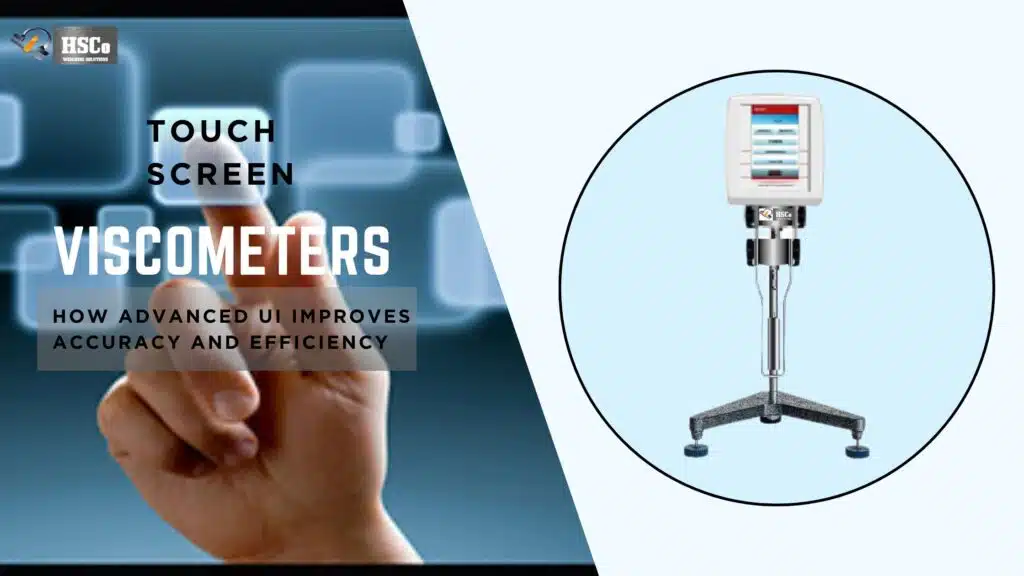


If you are in charge of quality or lab operations, you already know that viscosity numbers don’t tell the whole story. What matters is how those numbers change over time. Do they stay the same, slowly drift, or spike out of nowhere? This is where the data logging and graphing features of HSCO touchscreen viscometers come in very handy.
Want graphing and data logging on your bench?
Compare HSCo's density and viscosity meters. Tell the team which graphs and records you need and ask it to confirm those functions on the quoted model. See touchscreen viscometers
Touchscreen viscometers that are up to date don’t just measure viscosity. They record, store, and show data in ways that make quality control smarter and more proactive. In this blog, we’ll show you how to use these features well and give you useful tips you can use right away.
Why Data Logging is Important in QA/QC
Consistency is key in a QA/QC setting. Data logging lets you see real patterns instead of just one-time readings.
You can do the following with proper data logging:
- Keep an eye on how viscosity changes over shifts or batches
- Spot problems before they become defects
- Keep clear, traceable records to help with audits
You can stop problems before they happen instead of reacting to them.
What does it mean to log data in a touchscreen viscometer?
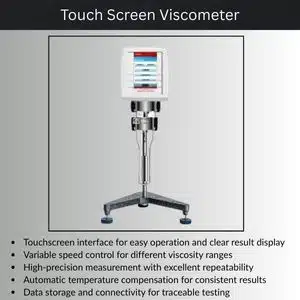
Data logging just means that the viscometer automatically saves the test results while and after each measurement.
Most touchscreen viscometers can keep track of:
- Values of viscosity
- Date and time
- Spindle and speed
- Heat
- Name or ID of the operator
You can look at or export all of this data later if you need to.
The Right Way to Set Up Data Logging
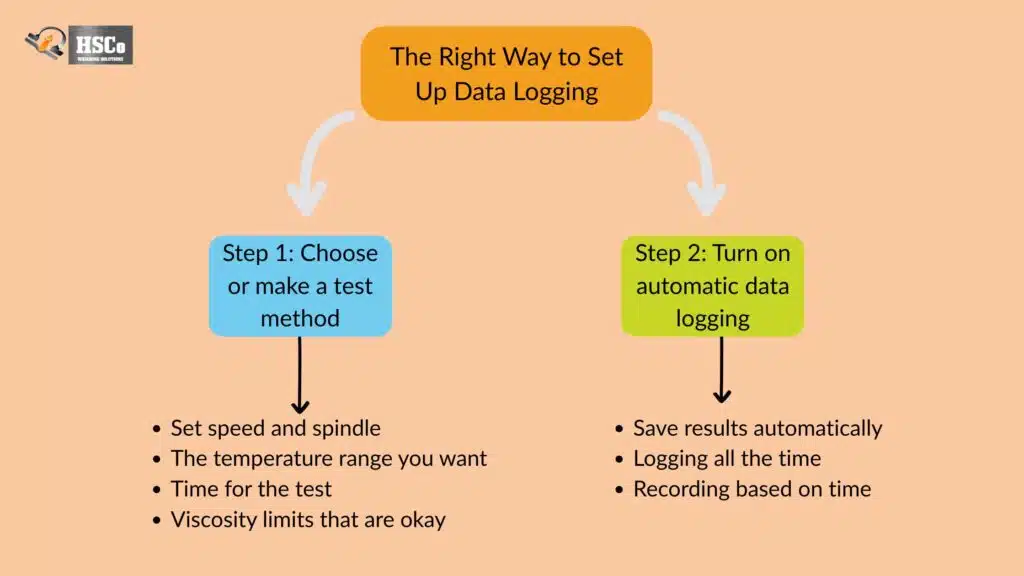
Step 1: Choose or make a test method
Choose a pre-made test method or make one before logging in.
A good test method should have:
- Set speed and spindle
- The temperature range you want
- Time for the test
- Viscosity limits that are okay
Using saved methods makes sure that every test is done the same way, no matter who does it.
Step 2: Turn on automatic data logging
Most touchscreen viscometers let you start logging data with just one tap.
Look for choices like:
- “Save results automatically”
- “Logging all the time”
- “Recording based on time”
For QA/QC work, logging that is done continuously or on a schedule is very helpful.
What Graphing Features Are and Why They Matter
Graphs make it easy to see what the numbers mean at a glance.
Graphing lets you do the following instead of scrolling through rows of data:
- See trends clearly
- Find instability or drift
- Look at the results of different batches side by side
This clear picture saves managers time and helps them make better decisions.
Common Types of Graphs
Time vs. Viscosity
This is the graph that most people use. It shows what happens to viscosity during a test.
Use it to:
- Check to see if the sample is stable
- Find settling or structural failure
- Compare how products act in different batches
A flat, stable line usually means you have good control.
Graphs of Torque or Shear Response
These graphs help prove that the measurements are being made in the right range of operation.
They are helpful for:
- Stopping errors caused by too much work
- Making sure the readings are accurate
Graphs of temperature and viscosity
This graph is very useful for businesses where temperature sensitivity is important.
It helps you:
- Check the temperature control
- Know how heat changes viscosity
How QA/QC Managers Can Make Better Decisions with Graphs
Find problems before they get worse
A graph makes it clear that a slow rise or fall may not set off alarms. If you catch this early, you can stop:
- Products that don’t meet specifications
- Fix or call back
- Complaints from customers
Look at shifts or operators side by side
It’s easy to tell if results change between shifts with graphs.
If one shift always shows differences, it could mean:
- Dealing with differences
- Inconsistent setups
- Gaps in training
How to Use Data Logging Effectively
These habits can make a big difference:
- Not just final results, but every important test should be logged
- Use the same way to test for comparisons
- Check graphs every week, not just during audits
- Clearly label data with information about the batch and the operator
Over time, these small steps will help you develop strong data discipline.
Sharing and exporting logged data
Most touchscreen viscometers make it easy to export data through:
- USB stick
- Connection to software
- Transfer over the network
You can use exported data to:
- Make reports for audits
- Tell production teams what you found
- Keep records for compliance
Having clear graphs and timestamps can speed up the whole audit process.
Example from the real world: stopping a batch from failing
Think of a paint factory that checks viscosity every hour. The viscosity stays within limits on one day, but the graph shows a steady upward trend.
Because the data is recorded and graphed:
- QA brings up the problem early
- Production changes the conditions for mixing
- A full batch rejection is not possible
The problem might not have been noticed if it hadn’t been graphed.
Things You Shouldn’t Do
You can misuse even the best tools. Keep an eye out for these:
- Logging data without looking at it
- Using different test settings to make comparisons
- Not thinking about how temperature affects things
- Not paying attention to small but steady trends
You can only use data if you actually use it.
Conclusion
Touchscreen viscometers are more than just measuring devices; they are also powerful quality tools thanks to their data logging and graphing capabilities. These features give QA/QC managers more control, clarity, and confidence. When used correctly, they help you spot trends, avoid problems, and stay compliant, all while saving you time.
You don’t have to guess what’s going on in your process; you can see it clearly on the screen and take action before problems get worse.
FAQs
1. How often should QA/QC labs keep track of viscosity data?
For important products, it’s best to log every test or at regular intervals to get an accurate picture of trends.
Can you change logged data after saving it?
Most systems don’t let you edit data to keep it safe, which is important for audits.
3. Are graphs available while testing is going on?
Yes, a lot of touchscreen viscometers show live graphs while the test is going on.
4. Do I need special software to see logged data?
Most of the time, basic viewing is built in, but advanced analysis may need PC software.
5. Is it helpful for small labs to log data too?
Yes, for sure. Better traceability and fewer mistakes are good for even small labs.